ROLE(S)
UX & Design, Strategy, Product Prototyping.
TEAM
1 Product Manager/Owner, 1 Product Designer (Me), 2 Software Engineers.
ASK
An easy to use and navigate dashboard displaying minute updates on the overview of COVID-19 cases, while catering to people who find data.gov.uk complex to understand and navigate.
SOLUTION
An intuitive dashboard displaying minute updates using cards and charts on the status of COVID-19 across the UK. The website also sources its information from data.gov.uk, which is displayed in a less complex and more understandable manner.
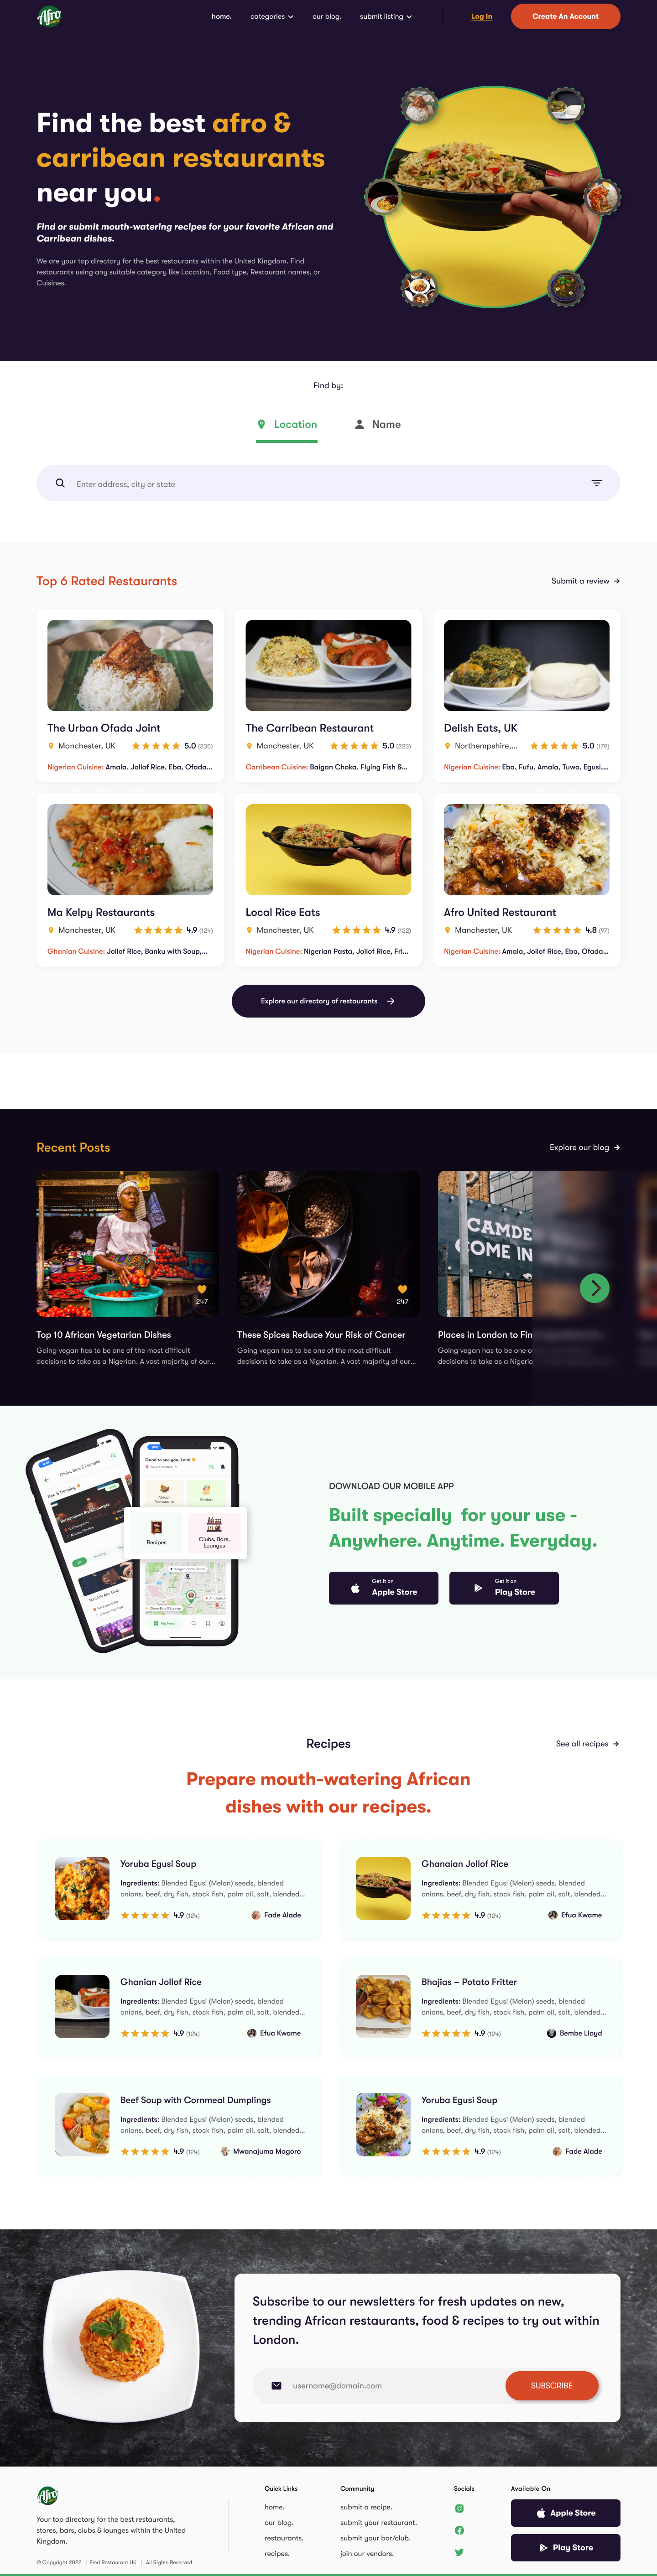
Medstats is an innovative platform that we designed to provide real-time, accurate, and understandable statistics on COVID-19 as well as other infectious diseases in the United Kingdom. It perfectly integrates real-time data from gov.uk, ensuring that visitors have access to the latest information on the number of cases, deaths, vaccinations given, hospitalizations, and more.
A key feature of the website is its ability to simplify complex data, making it more accessible and understandable for people of all ages and backgrounds. It presents the information in a clear and concise manner, using charts, graphs, and other visual aids to help users understand and interact with the trends and patterns.
Overall, the website serves as a valuable resource for anyone who wants to stay informed about the pandemic and make informed decisions to protect themselves and their loved ones.
The Website ✨

Keep scrolling on this image to view the website.
Scroll from the side to continue down the page.
Studying and analysing data on official websites
After I had gone through the brief and asked questions to clarify our goal; to design a website which displays data and statistics in layman terms and makes it understandable for all age demographic, the first thing I needed to do was study the website myself and write down parts of the data that seemed confusing to me, as well as questions that I had said aloud whilst going through the website.
After that, I sought out 4 friends and family in total who fall between ages 15-68 to go through the website while I observe them. I also instructed them to speak their thoughts aloud while perusing the website. The following were what I deduced from them going through the websites.
- The website was overwhelming at first glance and they didn't know where to begin from
- Navigation is tricky and confusing
- In-depth information about each data display is really helpful
- A lot of the data titles are similar, but display different data
- It is difficult to find previous data of a specific data type
- Some of the line charts aren't interactive, and as such we can't see data for specific periods
- Some of the data display types are confusing
- The summary pages are also really good.
This really helped me to understand where to start from and what parts needed major changes to the display type according to the patterns that showed up more often across all demographics. To create a easy navigation, and to make design process faster, I started with a sitemap, which was subsequently iterated upon as I designed the website.

Then comes the wireframes...
If it's not a robust/complex project, I like to skip wireframes. But I needed the wireframes here to help me construct the layout and put my ideas to work. As well as for easier and faster iteration and to present my ideas better to the product owner and stakeholders.

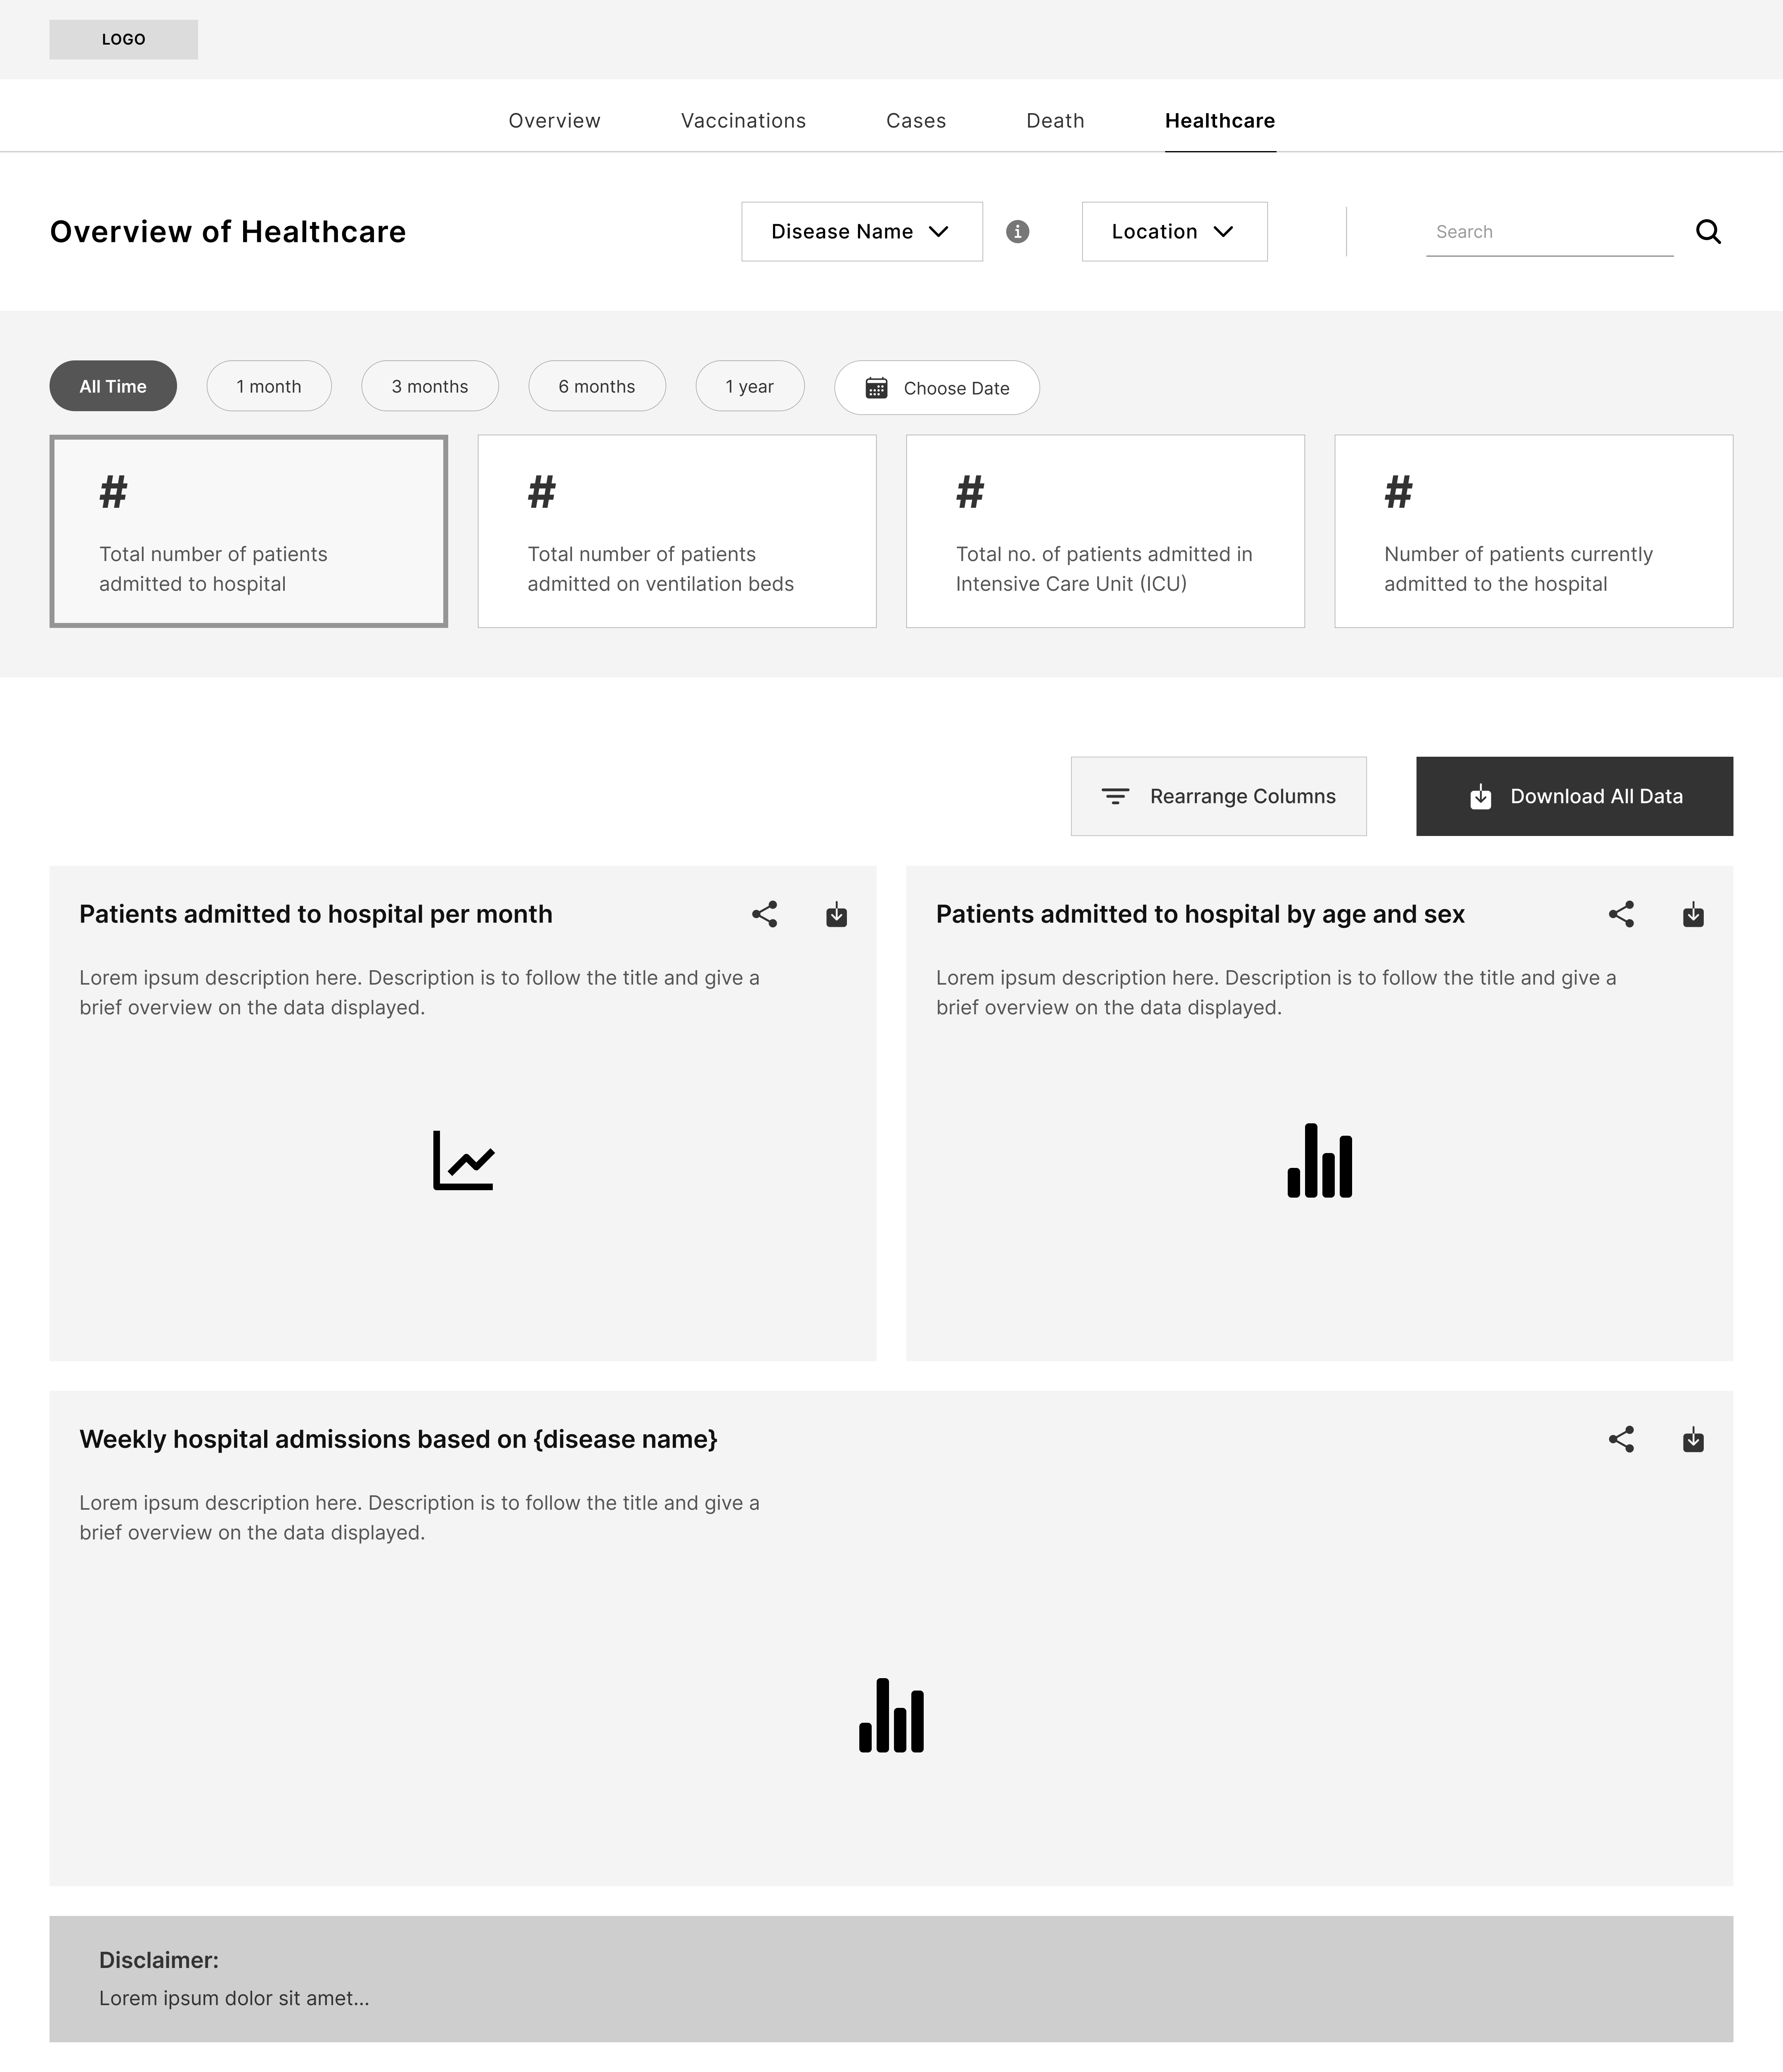
And then high-fidelity mockups.
Scroll on the images to see more
A lot of changes were made while I worked on this design. Learning how to display data and the best visualization methods to use for each specific data was tricky and required research on my part. At the end of the day, I tested and compared it with the same group of people, and they stated that it was less overwhelming and was very much understandable for them, even though some parts aren't as in-depth as on the official website.
It was also important that we added a disclaimer and referenced the official gov.uk website to let people know that the data were integrated in real-time from the official website.
More info on the COVID-19 disease is also presented on a different page for people to understand the disease and its complications.
The website is also built to be responsive across various devices.

Go to top
.png)